


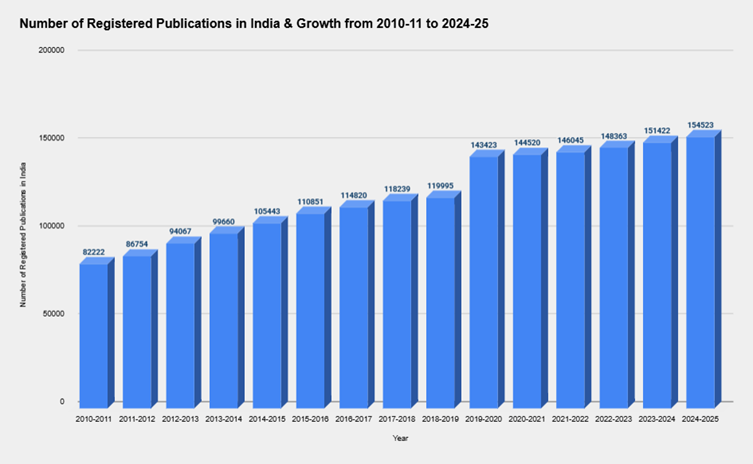
Number of Registered Publications in India and Growth from 2010-11 to 2025-26

| Sr.No. | Year (Ending) | Daily | Bi/Tri-Weekly | Weekly | Others | Total |
|---|---|---|---|---|---|---|
| 1 | 2010-2011 | 10205 | 394 | 27321 | 44202 | 82222 |
| 2 | 2011-2012 | 10908 | 396 | 28819 | 46631 | 86754 |
| 3 | 2012-2013 | 12109 | 402 | 31280 | 50276 | 94067 |
| 4 | 2013-2014 | 13350 | 411 | 33170 | 52729 | 99660 |
| 5 | 2014-2015 | 14573 | 411 | 34991 | 55468 | 105443 |
| 6 | 2015-2016 | 15723 | 413 | 36635 | 58080 | 110851 |
| 7 | 2016-2017 | 16580 | 413 | 37829 | 59998 | 114820 |
| 8 | 2017-2018 | 17160 | 413 | 38933 | 61733 | 118239 |
| 9 | 2018-2019 | 17504 | 413 | 39436 | 62642 | 119995 |
| 10 | 2019-2020 | 19782 | 539 | 44519 | 78583 | 143423 |
| 11 | 2020-2021 | 19971 | 541 | 44899 | 79109 | 144520 |
| 12 | 2021-2022 | 20278 | 543 | 45395 | 79829 | 146045 |
| 13 | 2022-2023 | 20881 | 547 | 46071 | 80864 | 148363 |
| 14 | 2023-2024 | 21642 | 548 | 47052 | 82180 | 151422 |
| 15 | 2024-2025 | 22759 | 558 | 47736 | 83470 | 154523 |
* Others includes Fortnightly, Monthly, Quarterly, Half-yearly, Yearly etc.
Source: PRG